How to Use the VSCode Debugger
This guide will walk you through the process of using the debugger build into VSCode. If you run into any issues, please contact the subject staff.
Step 1
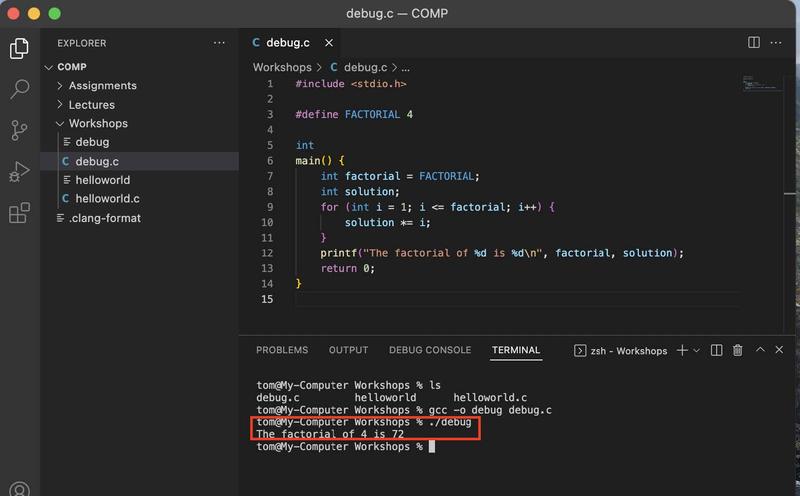
We will run through an example of debugging a compiled program that tries to calculate factorial but produces the wrong output.
Step 2
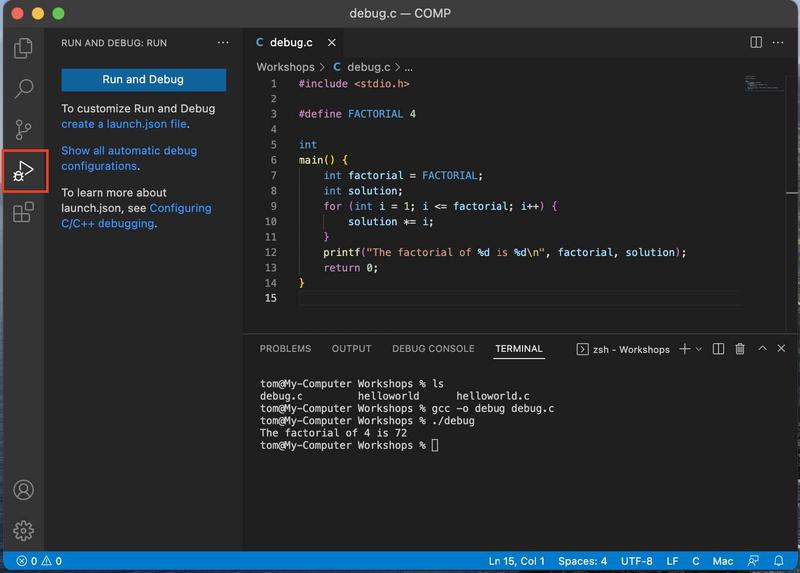
Click the Debug menu on the left.
Step 3
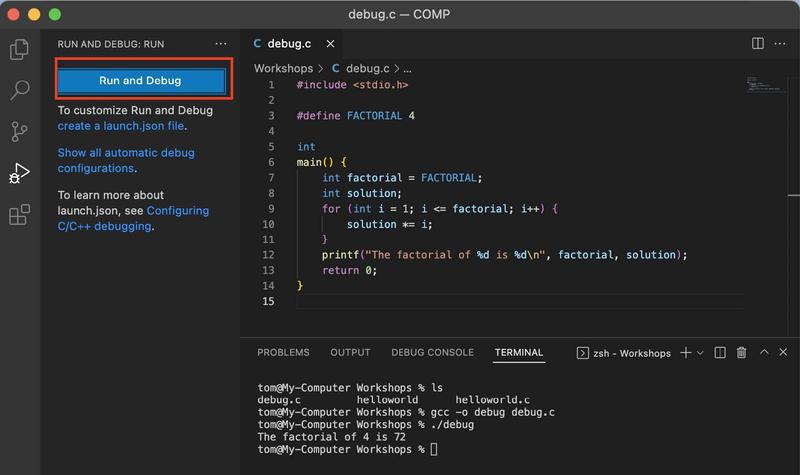
To debug you can click “Run and Debug”.
Step 4
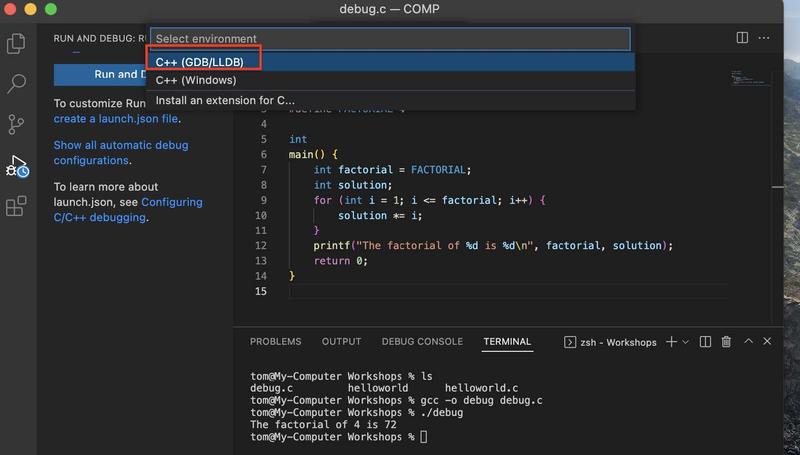
Select “C++ (GDB/LLDB)”.
Step 5
Select “gcc”
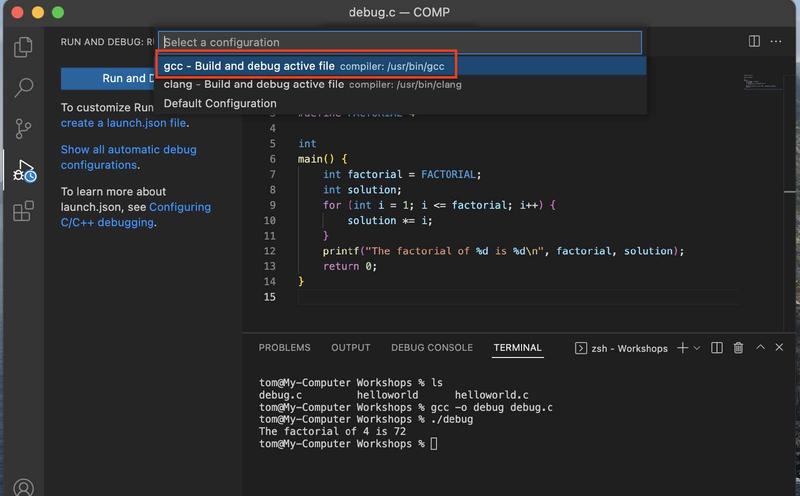
Step 6
Before you debug, you may wish to add a breakpoint to stop the program at that line. You can do this by clicking to the left of the line number and a red dot will appear.
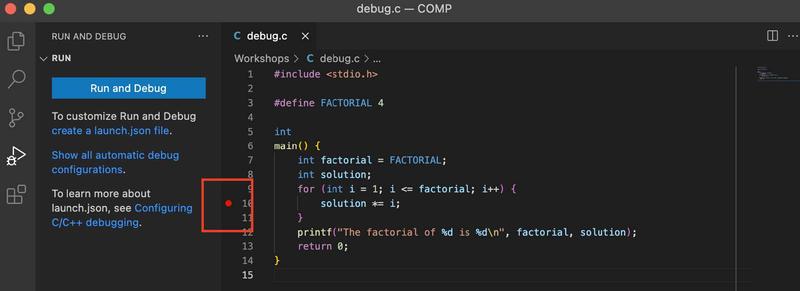
Step 7
When you “Run and Debug” the program stops at the breakpoint. Note the Variables presented in the top left and their live values. We may already notice an issue, before line 10 is run (the current line is highlighted in yellow), the value for the solution is 3.
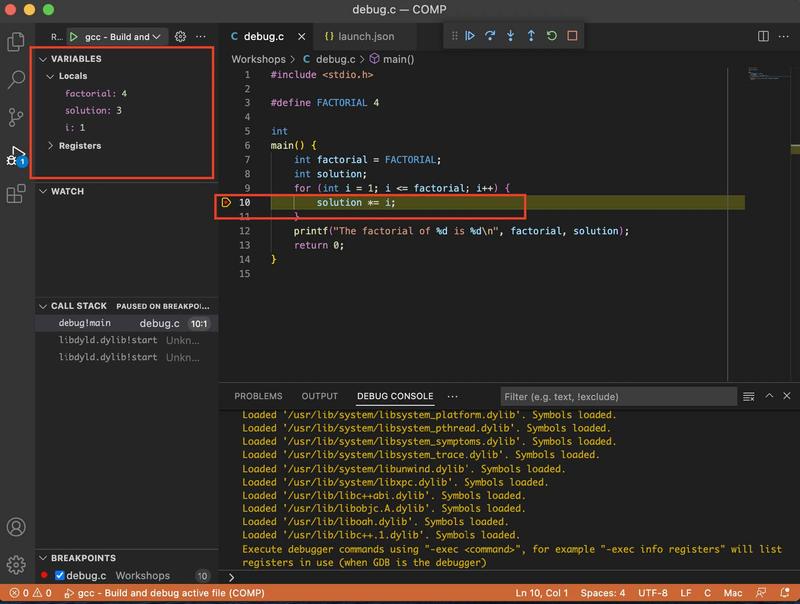
Step 8
We can run the program with the coloured buttons at the top, choosing options to move line by line, to the next break point and other useful options. As we can see, after line 10 is run, the code goes back to line 9 after multiplying ‘solution’ by ‘i’.
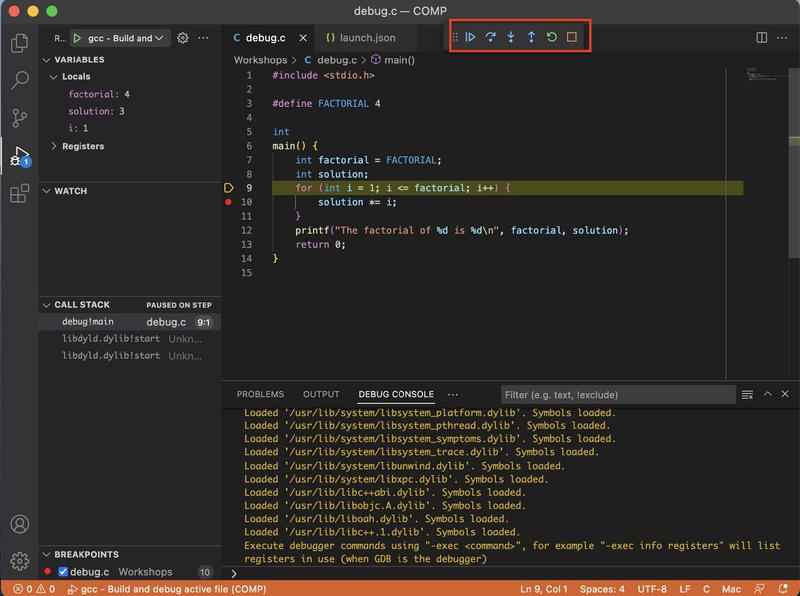
Step 9
The value of ‘i’ is incremented by 1.
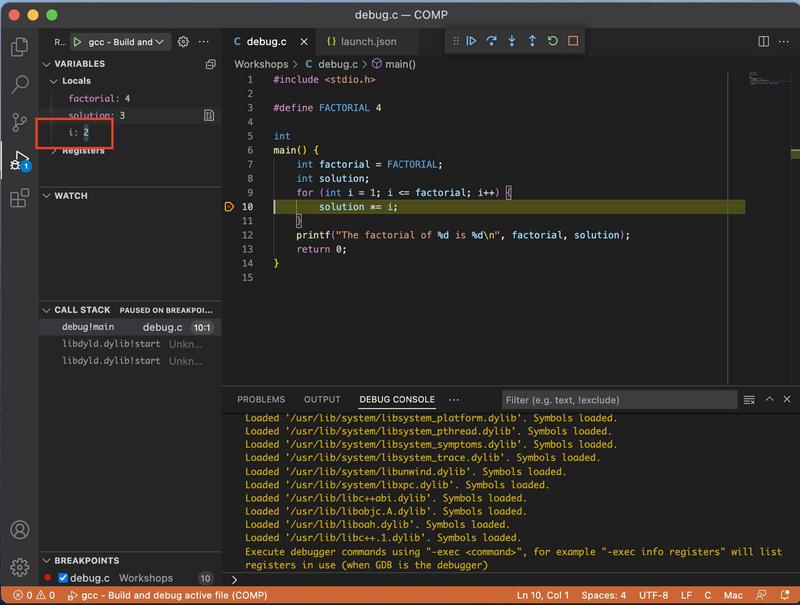
Step 10
The value of ‘solution’ is multiplied by ‘i’ which is assigned 6. The factorial seems to be working apart from the initial value.
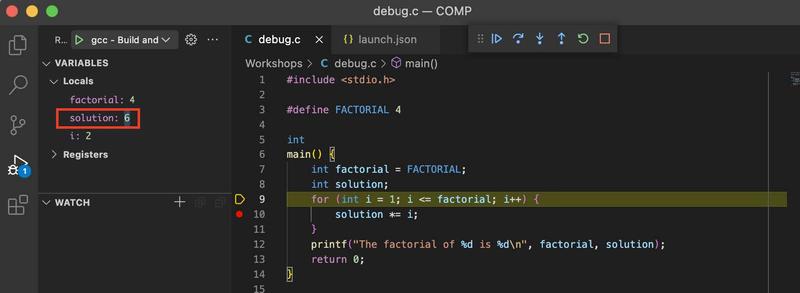
Step 11
We run through the program until the loop exits and the value of ‘solution’ is 72, we can divide this by the initial value 3 in the terminal value to check the actual solution. 4! = 24. We need to initialise ‘solution’ on line 8 to 1.
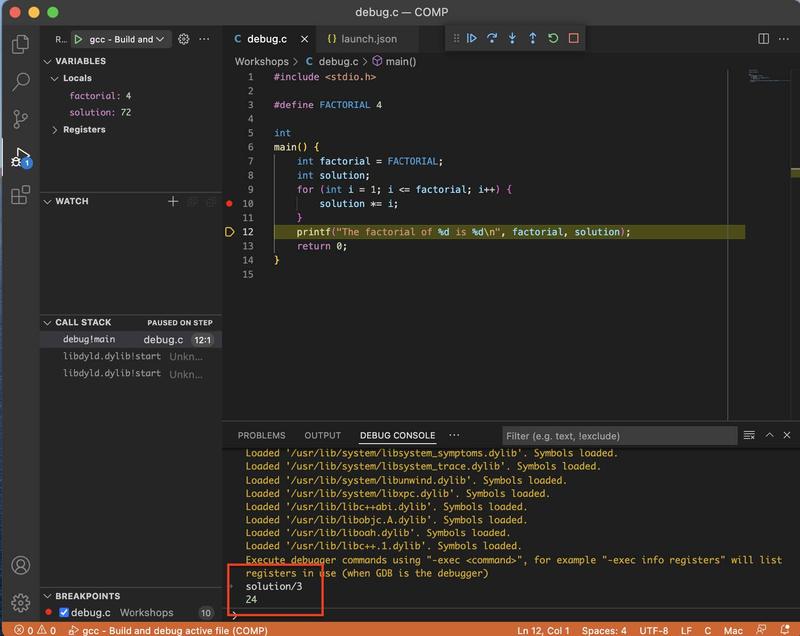
Step 12
Note, had we added the flag “-Wall” (Warnings All) to the compilation line we would have received a warning message and note making the problem obvious.
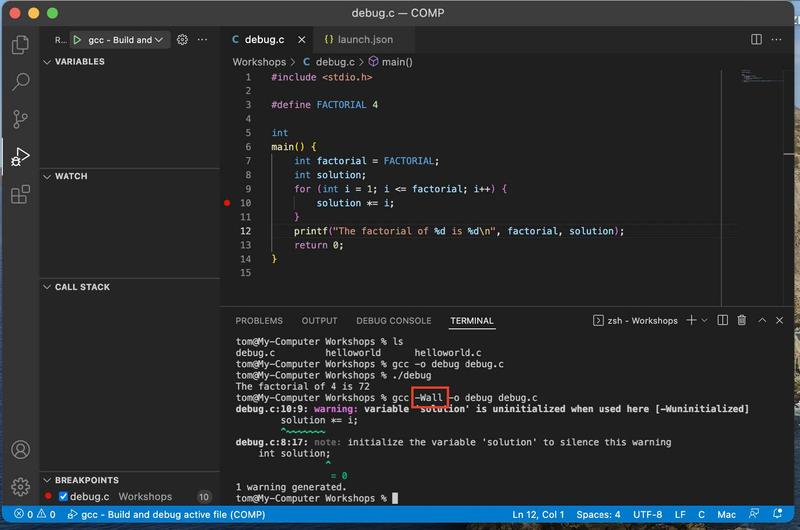
Prepared by Thomas Minuzzo, February 2022